

Bitcoin at a Crossroads

Key Takeaways
- Bitcoin is +600% from 2022 lows, with profit-taking evident from long-term holders
- Gold’s rally, quantum fears, and China-linked selling shape market dynamics
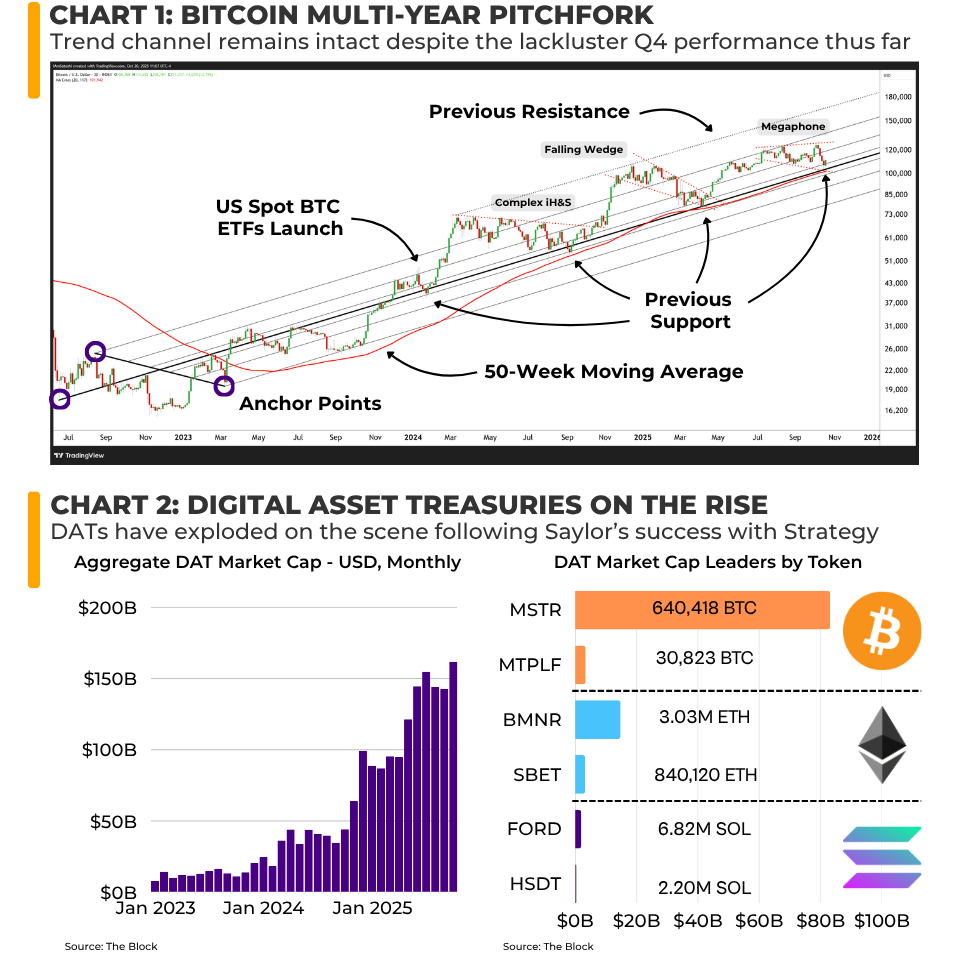
- BTC is holding the 50-week MA; <$103K risks reversal, >$126K targets $150K–$180K
Digital Asset Commentary
As the Bitcoin bull market nears its three-year anniversary, measured from the 2022 low, many traders are beginning to wonder how much longer the rally can last. Historically, Bitcoin has experienced three strongly bullish years followed by a deep, year-long bear market correction. Now more than 600% above the 2022 bottom and having reached the psychological $100k level, many long-term holders have begun taking profits, as evidenced by on-chain data. So far, there has been a clear handoff from earlier investors to new ETF buyers, though recent price stagnation suggests the market has reached a near-term equilibrium.
Additional factors influencing selling behavior include the ongoing gold rally and emerging fears around quantum computing. While upgrades to cryptography may eventually be required, this is likely at least 5–10 years away. The performance gap between gold & Bitcoin this year may also reflect broader geopolitical dynamics, China has been pushing toward gold, while the US has focused on crypto & stablecoin leadership. Supporting this view, numerous China-linked wallets have sold large amounts of BTC in recent weeks, including coins traced back to a Chinese mining farm active between 2012 & 2014.
On the technical side, Bitcoin remains at a key support level on higher timeframes. Price has held within a multi-year trend channel since 2022, with the channel’s midpoint acting as an important support/resistance pivot. Confluence is added by the 50-week moving average, which has provided support since the 2023 transition from bearish to bullish conditions. A decisive weekly close below the current low of $103K would suggest the multi-year rally is over. Since the launch of spot BTC ETFs in January 2024, price action has returned to this key midpoint while forming bullish continuation patterns. A potential megaphone structure is currently developing, with a series of higher highs & lower lows. A breakout above the $126k all-time high would signal renewed bullish momentum, with a measured move target near $150k. A maximum likely year-end target sits closer to $180k, based on previous resistance levels from Q1 2023 & 2024.
 Download Commentary