

From Exponential Asset to Macro Instrument: Bitcoin’s Evolving Relationship with M2

Key Insights:
- Bitcoin and M2 have historically been highly correlated: Changes in global M2 liquidity have played a defining role in Bitcoin’s bull and bear cycles, amplifying the structural impact of the four-year halving cycle.
- Bitcoin’s volatility has declined: As Bitcoin has matured and grown in market value, both its volatility and sensitivity to M2 fluctuations have decreased, likely due to the rise of derivatives markets, institutional participation, and price-insensitive capital such as digital asset treasuries.
- The effectiveness of the M2 signal has weakened: Although the correlation between Bitcoin and M2 remains significant, the signal’s performance has diminished in recent years, reflecting Bitcoin’s reduced volatility and increasing integration into broader macro markets.
Introduction:
The prevailing narrative surrounding Bitcoin has long centered on its role as “digital gold” and “sound money,” though the importance of these narratives has evolved as the network has matured. Over recent cycles, another framework has emerged: Bitcoin functions as a global liquidity sponge. This can be observed by examining the relationship between Bitcoin’s price and the M2 money supply, which has shown sustained periods of meaningful correlation. As a result, Bitcoin can be understood as a form of “liquidity beta.”
More broadly, as assets mature and integrate into global macro frameworks, their volatility profiles tend to compress; larger, more established assets respond more slowly to changing conditions. Bitcoin increasingly reflects this dynamic, with its price movements closely tied to the expansion and contraction of global liquidity, as measured by M2.

This shift is evident in the compression of the BTC/M2 relationship. In earlier cycles, the correlation was amplified by expectations of exponential growth, driving significant multiple expansion. However, as Bitcoin has matured and volatility has declined, that multiple expansion has likewise become more constrained.
While the correlation remains a defining feature of market cycles, it is the direction of liquidity itself that serves as the true gatekeeper. Expanding liquidity signals a regime conducive to bull market behavior, while contracting liquidity increases the probability of sideways or bear-market conditions.
The Model:
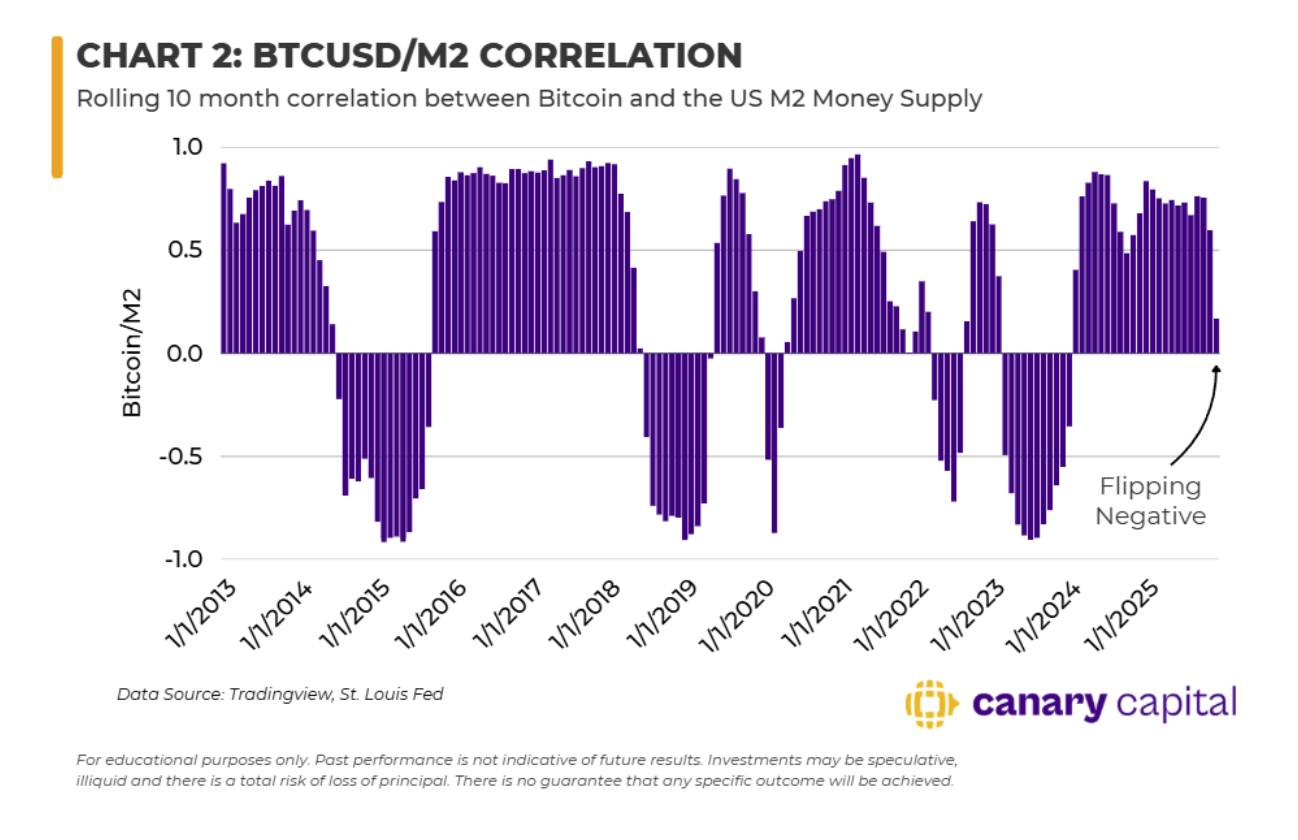
The core of this systematic approach is identifying regime shifts using a rolling correlation framework. Specifically, a sustained two-month period of positive correlation between Bitcoin returns and year-over-year M2 growth signals the opening of the “Liquidity Gate.” This occurred in March 2020 and again in August 2023. Conversely, the Liquidity Gate closes when two months of sustained negative correlation coincide with a decelerating liquidity impulse, as seen in December 2021 and more recently in November 2025.
The model measures a 10-month rolling correlation coefficient to determine how closely Bitcoin tracks M2 liquidity. This identifies whether Bitcoin is behaving as a “liquidity beta” (positive correlation) or decoupling from macro liquidity (negative correlation). An additional “acceleration” component measures the rate of change in this relationship by subtracting the average correlation of the prior two months from the current reading. This helps determine whether the correlation is strengthening or weakening. Together, the absolute correlation and its rate of change generate actionable signals. During risk-off periods, capital is rotated into 3-month Treasuries.
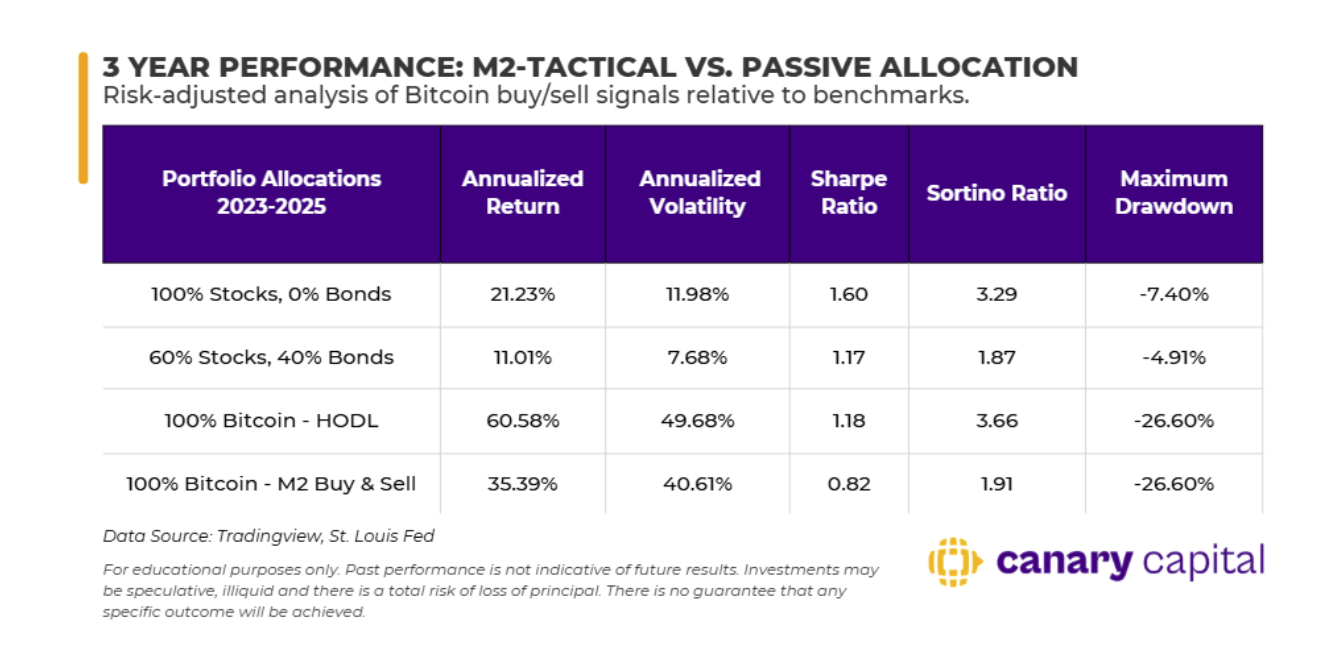
Incorporating the M2 signal into a trading strategy has materially improved performance relative to buy-and-hold by avoiding major bear markets and restrictive monetary regimes. Since 2013, the strategy has delivered more than double the total return of a passive approach while significantly improving risk-adjusted returns. Maximum drawdown was reduced from 82.10% to 62.76%, and the Sortino Ratio improved from 2.40 to 2.92. These improvements were driven by exits ahead of the 2015, 2018, and 2022 bear markets. Most notably, the model has recently triggered another exit signal, consistent with the current bear market environment.

One notable example of the model’s effectiveness occurred ahead of the March 2020 COVID-19 flash crash. The model generated an exit signal prior to the drawdown, avoiding the worst of the decline. It later signaled re-entry after markets stabilized, as central banks implemented highly dovish monetary policy and liquidity conditions rapidly improved.
However, the model showed weaker performance in 2023. Although it correctly signaled an exit, asset prices rebounded much faster than the M2 signal indicated, resulting in a delayed re-entry and a higher, less favorable entry price. While the strategy remained profitable, this lag highlights a key limitation: the model is more effective at identifying risk-off conditions than precisely timing risk-on re-entries. As a result, despite strong longer-term performance, it underperformed a simple buy-and-hold strategy over the most recent three-year period.
A key limitation of M2-based analysis is the relatively small sample size of major monetary policy regime shifts available for testing. While the liquidity beta signal has proven highly effective as part of a broader portfolio strategy, particularly in identifying when to reduce crypto exposure, it is less reliable at precisely timing when to re-enter risk.
Broader Correlation:
Looking beyond M2, Bitcoin’s correlation with other asset classes provides additional insight into its evolving macro integration. Over the past year, crypto has maintained a mostly positive correlation with equities, reinforcing its sensitivity to broader risk sentiment. However, notable decoupling events occurred in October 2025 and February 2026, when correlations across equities, Treasuries, and major currencies simultaneously weakened or inverted. The October 2025 equity decoupling was especially significant, occurring just days before the October 10 margin-driven flash crash that materially altered crypto market structure.
Bitcoin also showed intermittent positive correlation with gold during periods of volatility in late 2025, but has recently failed to participate in the historic rally in precious metals. Meanwhile, the Japanese Yen and Euro exhibited episodic negative correlation, particularly during periods of liquidity stress and year-end funding shifts, though these relationships have been less stable and more inconsistent over time.

The Importance of the Fed and Treasury Debt
With Kevin Warsh nominated as the next Fed Chair, he has signaled an intention to simultaneously tighten the Fed’s balance sheet while cutting interest rates. Although lower rates typically support M2 growth and broader liquidity expansion, balance sheet tightening could partially offset this effect, redirecting liquidity into more asset-specific channels rather than the financial system as a whole.
This dynamic is further complicated by the growing U.S. federal debt burden, which is approaching $39 trillion. A key factor is the composition of that debt, specifically, the increasing reliance on short-term Treasury Bills rather than longer-duration bonds. During the COVID-19 crisis, trillions of dollars in T-Bills were issued to rapidly fund emergency spending. Combined with the Fed’s large-scale quantitative easing, this influx of short-term liquidity helped fuel the speculative asset bubble of 2021.
Today, a growing percentage of outstanding U.S. government debt is funded through T-Bills, and this proportion is likely to rise further if rate cuts continue. This structure injects persistent short-term liquidity into financial markets, which may ultimately contribute to reopening the Liquidity Gate for Bitcoin and crypto more broadly. We’ve seen this ratio rise over the last several months, which may contribute to a bullish resolution later this year.

Looking ahead, a key question is how Bitcoin’s sensitivity to liquidity will evolve in the next bull cycle. As the asset matures, cycle peaks may become more compressed, but the BTC/M2 relationship should remain a valuable framework for identifying regime shifts. During bear markets, Bitcoin often trades like a generic risk asset, prone to idiosyncratic shocks and temporary decoupling from liquidity conditions. However, once correlation stabilizes and liquidity begins expanding again, Bitcoin’s role as a primary beneficiary of global liquidity growth is likely to reassert itself.
Because fiat monetary systems are structurally inflationary, the long-term foundation for this liquidity-driven relationship remains intact. The key signal to monitor is the reopening of the Liquidity Gate, which would mark the transition back to a favorable regime for Bitcoin. Beyond liquidity itself, the potential adoption of Bitcoin as a reserve asset by a G20 central bank would represent a major structural milestone and further reinforce its role within the global monetary system.
