

The Gravity of Bitcoin’s 20-WMA

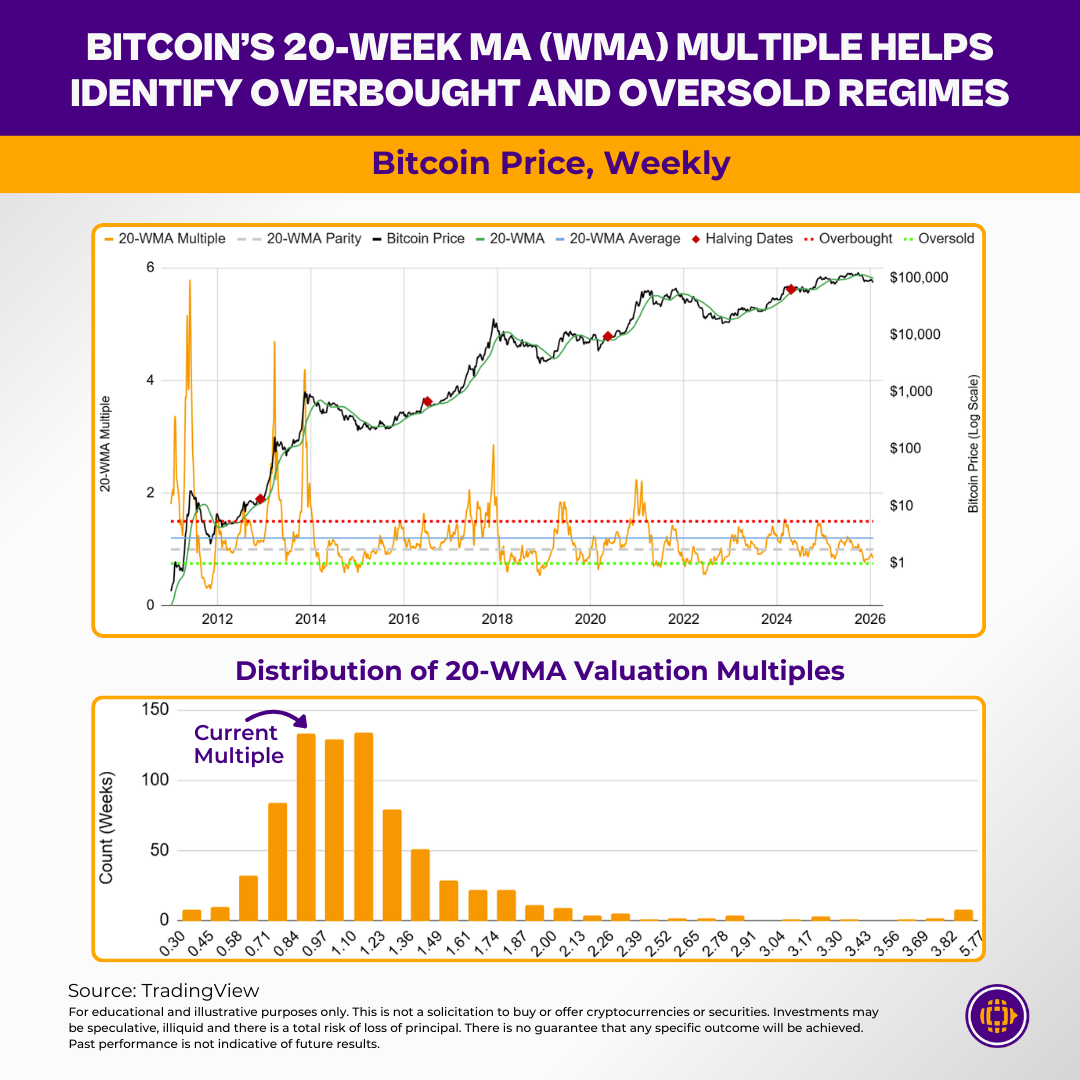
One of the most persistent features of Bitcoin’s long-term price behavior is its relationship to the 20-week weighted moving average (20-WMA). Across market cycles, this moving average has acted less like a simple trend indicator and more like a gravitational center—a level price repeatedly stretches away from during moments of euphoria or panic, only to eventually be pulled back toward.
By examining Bitcoin’s price relative to its 20-WMA, rather than price alone, we gain a clearer view of valuation extremes and regime shifts that are often obscured in nominal price charts.
Why the 20-Week WMA Matters
The 20-week timeframe captures Bitcoin’s intermediate-to-long-term trend, smoothing out short-term volatility while remaining responsive enough to reflect structural changes in market momentum. Using a weighted moving average further emphasizes recent price action, making the signal more adaptive during transitions between bull and bear phases.
Historically, the 20-WMA has served as:
- Support during bull markets, where pullbacks often find buyers near the average
- Resistance during bear markets, where rallies stall as price fails to reclaim it
- A valuation anchor, toward which price repeatedly mean-reverts over time
This recurring interaction is what gives rise to the concept of gravity—price can deviate, sometimes dramatically, but it rarely escapes indefinitely.
The 20-WMA Multiple: A Valuation Lens
Rather than looking at absolute price levels, the chart above focuses on the 20-WMA multiple, calculated as:
Bitcoin Price ÷ 20-Week WMA
This framing normalizes Bitcoin’s valuation across cycles, allowing comparisons between vastly different price regimes—from early-stage adoption to today’s institutional market.
Over time, several consistent patterns emerge:
- Overbought regimes (red zone):
When the multiple expands meaningfully above its historical average, Bitcoin has typically been in late-cycle, momentum-driven phases. These periods have often coincided with euphoric sentiment and, historically, proximity to major cycle peaks. - Oversold regimes (green zone):
When the multiple compresses below long-term norms, it has tended to mark periods of capitulation, exhaustion, or prolonged consolidation—conditions that have historically aligned with long-term accumulation opportunities. - Mean reversion:
Across cycles, extreme deviations—both high and low—have eventually reverted back toward the 20-WMA, reinforcing its role as a structural equilibrium point.
What the Distribution Tells Us
The lower panel of the chart shows the distribution of historical 20-WMA multiples, offering additional context for where current conditions sit within Bitcoin’s broader history.
Most observations cluster tightly around the long-term average, while extreme readings form a thinner tail on either side. This skewed distribution underscores an important insight:
Extreme valuations are rare—and short-lived—relative to Bitcoin’s full trading history.
The current multiple, highlighted near 0.84, sits in the lower portion of the historical distribution. This does indicate oversold conditions, but it is notably not at the most extreme lows seen during prior cycle bottoms.
Interpreting the Current Regime
At a multiple of 0.84, Bitcoin appears discounted relative to its 20-week trend, suggesting downside pressure has pushed price below its structural mean. However, history suggests a distinction worth emphasizing:
- This level reflects oversold, not deeply distressed, conditions
- Previous generational bottoms have often required more extreme compression in the multiple
- Mean reversion remains the dominant long-term force, but timing and path are variable
In other words, the signal points to valuation relief, not necessarily cycle completion.
Takeaway: Gravity Still Applies
Bitcoin’s long-term price behavior continues to demonstrate a powerful tendency toward mean reversion around the 20-week weighted moving average. While narratives, liquidity cycles, and macro conditions evolve, this structural relationship has remained remarkably durable.
The current 20-WMA multiple suggests Bitcoin is trading below its long-term trend, reflecting oversold conditions without signaling historical extremes. As in prior cycles, the key insight is not precision timing, but context: understanding where price sits relative to its gravitational center can help frame risk, opportunity, and regime shifts more clearly than price alone.
As always, this analysis is for educational purposes only and should be considered within a broader risk-management framework.
